2022-2023
Penciv
Full-stack engineering on a feelings journal app, the antithesis of social media. Built the emotion color system and a Spotify Wrapped-style analytics experience.
Overview
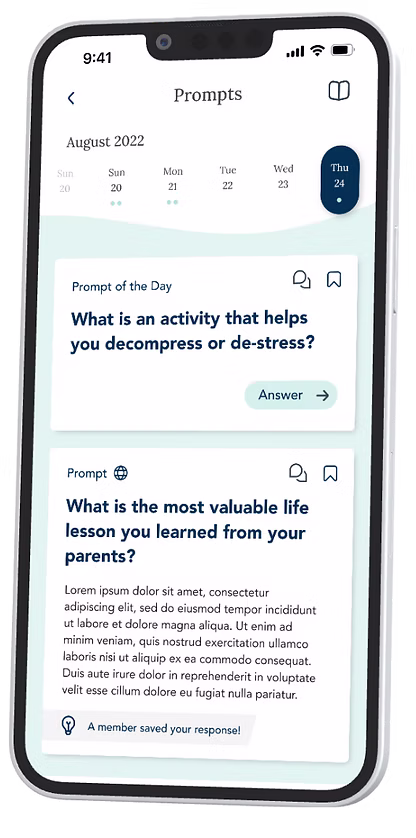
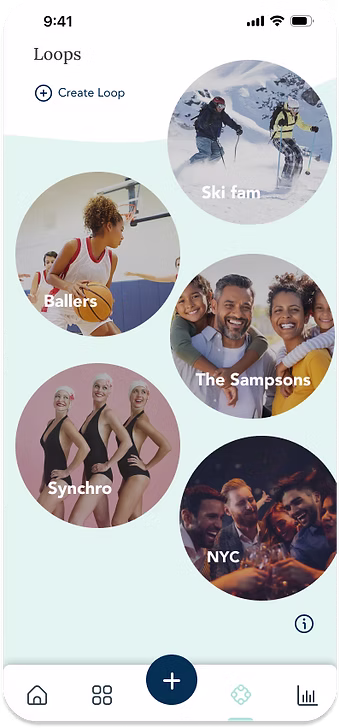
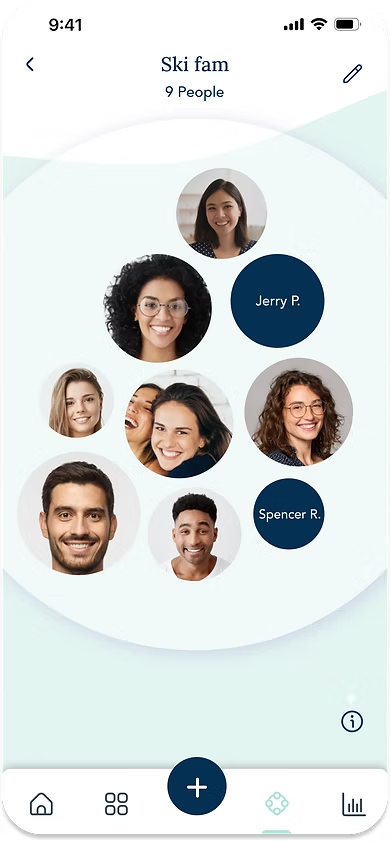
Penciv is a mobile app built on a simple premise: social media rewards performance, but real life is messier than that. Instead of sharing curated highlights, Penciv lets you log how you actually feel, tagging emotions from a rich palette of "feels," and share honest reflections with small circles of friends and family called "loops." Daily prompts encourage introspection, and the app surfaces patterns in your emotional life over time without ever telling you how you should feel. I joined Penciv as a full-stack engineer, working across the React Native frontend and PostgreSQL backend. My most significant contribution was designing and engineering the feels color system, the visual language that maps emotions to colors throughout the app, and building the data tab, a monthly analytics experience that shows users how their feelings have trended over time.
Challenge
The core design challenge was visualization without judgment. Most mood-tracking apps map emotions to a good-bad axis (green for happy, red for sad). That framing defeats the purpose of honest self-reflection. We needed a visual system that treated sadness and joy with equal weight, made complex emotional patterns legible at a glance, and felt warm rather than clinical. On the engineering side, aggregating and visualizing emotional data across time required building a flexible tagging and querying system. Users tag multiple feels per entry, associate them with people and categories, and expect to see meaningful summaries by month, something like Spotify Wrapped, but for your inner life.
Approach
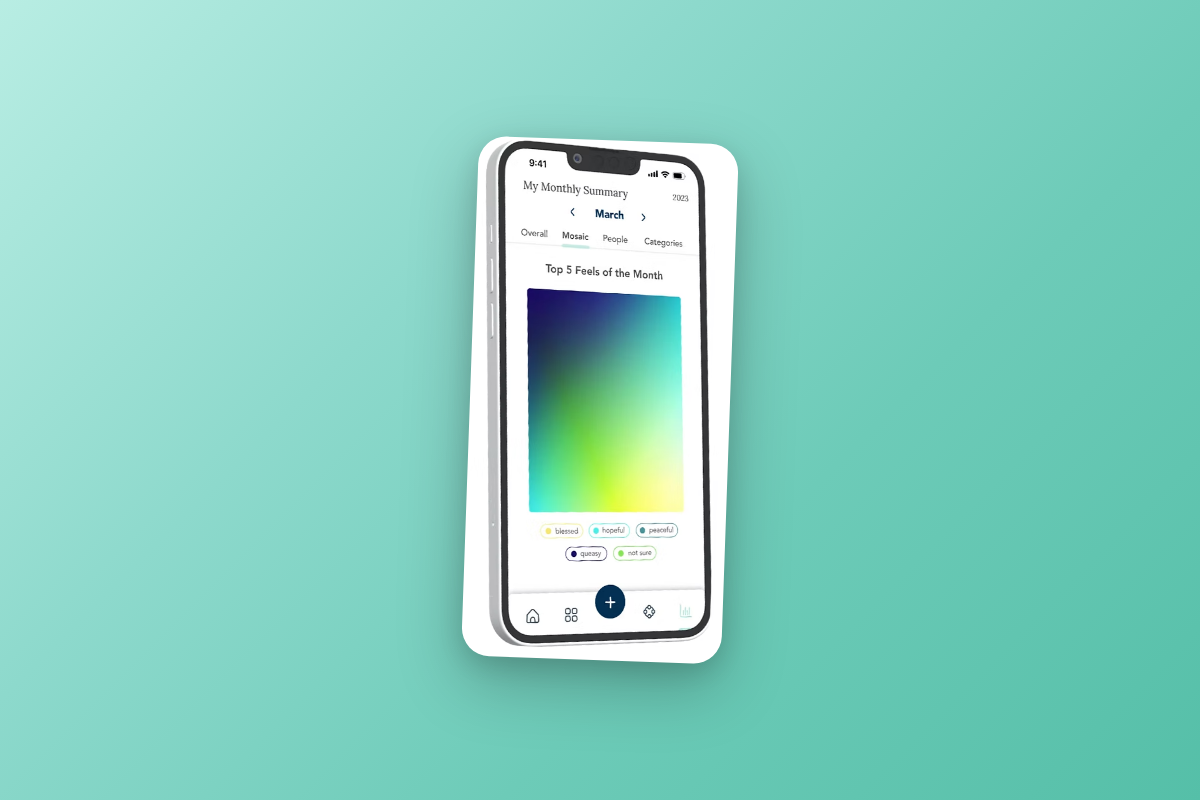
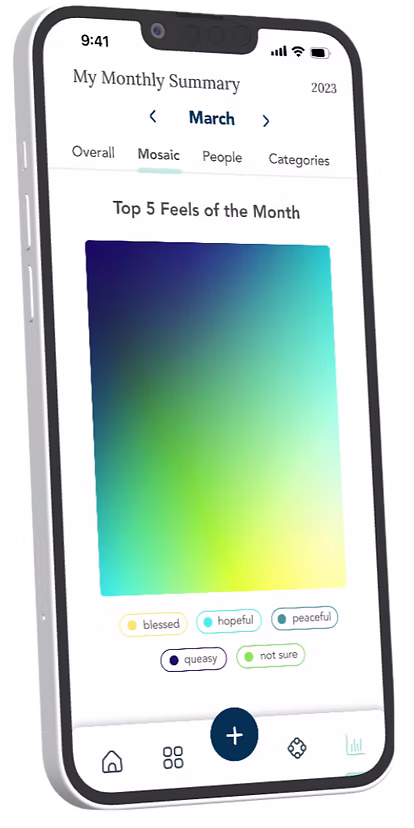
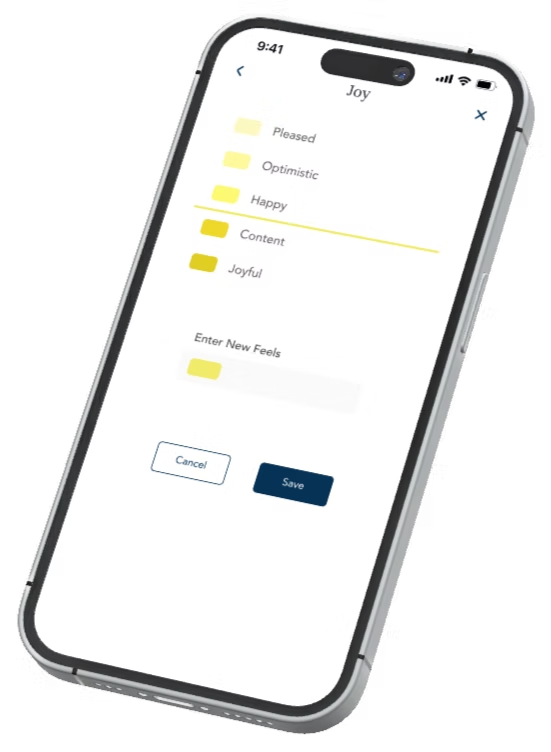
For the feels color scheme, I designed a mapping where each core emotion (Love, Joy, Anger, Fear, Awe, Vulnerability, Sadness, Strength) gets a distinct, saturated color with no hierarchy and no green-good/red-bad mapping. The palette was tested for accessibility and visual harmony, so the monthly mosaic view (a gradient composed of that month's feels) produces something beautiful regardless of what emotions dominated. For the data tab, I built the backend aggregation queries in PostgreSQL and the frontend visualizations in React Native. The monthly summary shows a pie chart breakdown of overall feels, a mosaic gradient, per-person emotional patterns, and category-level trends. The key design constraint was non-judgmental framing: the visualizations show what happened, not whether it was good or bad. A month heavy on sadness renders just as coherently as a month heavy on joy.
Impact
The feels color system became the visual identity of the app. It's the first thing users see and the thread that ties the experience together. The data tab gave users a reason to keep logging: the longer you use Penciv, the richer your personal emotional archive becomes.
Previous
← Markit Social